PlanePlotter is a popular software tool designed for tracking and visualizing aircraft by decoding ADS-B, ACARS, HFDL, and Mode-S transmissions. It allows users to monitor live air traffic and offers powerful tools for enthusiasts and professionals. The software is compatible with various platforms, such as Windows, and works seamlessly with a wide range of receivers and software-defined radios (SDRs). The installation is quite complicated, additional programs are required even out-of-date ones that will jolt your antivirus, and the instructions via Help are not quite up-to-date, so arm yourself with lots and lots of patience and if you are unfamiliar with TCP/IP protocols and COM ports use a few friends to help you out.

Then, with the RTL-SDR flash drive inserted into a USB port on your computer, a program such as rtl1090 (which you can download from https://rtl1090.com) you can see the air traffic passing over your home.
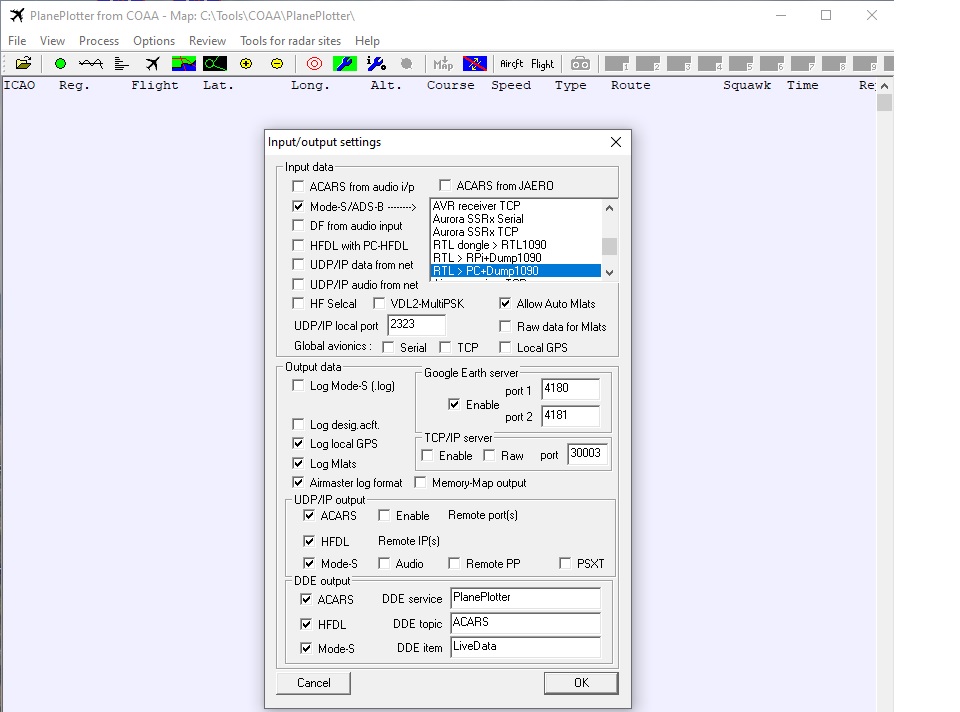
With these connections made and the software, TCP/IP connection, and I/O data between the two programs (PlanePlotter and rtl1090) configured, PlanePlotter decoding begins with a click on the green dot icon, the second from the left. After the click it will become a black square and reception, theoretically, should begin.
I immediately propose any problems so that they can be solved without searching the Web.
First problem, immediately solvable:
The home screen provides by default (version 6.6.9.4) fixed satellite data.

This data can be deleted by disabling this: Enable Inmarsat plots

Close PlanePlotter and restart PlanePlotter
Second problem less easy to solve
No data received from the receiver (if you see data scrolling on the receiver) and error Failed to connect to the receiver.

Check the connection to the receiver in two places:
Options>Mode-S receiverRTL dongle RTL1090>Setup TCP/IP client
The numbers must be the same and that is, if in Config of rtl1090 there is an upper box with 127.0.0.1 and in the lower box 31012 then in the RT dongle TCP/IP server IP box you must write the same numbers separated by the colon 127.0.0.1:31012 as in the example below.

Part I
To properly view routes, aircraft, etc., go to Options > Script > and download all the Fetch options (except for Fetch share locations if you do not want to share data).

Key Features of PlanePlotter:
Aircraft Position Tracking:
Displays real-time positions of aircraft based on ADS-B signals and other data sources.
Data Decoding:
Decodes messages from multiple data formats like ADS-B, ACARS, HFDL, and Mode-S.
Sharing Data:
Users can share received data with others in real time, contributing to a global air traffic monitoring network. Check the legislation because in some countries listening to certain frequencies is not allowed.
Customizable Interface:
Includes options to customize maps, display settings, and graphical overlays for enhanced user experience.
Additional Features:
Provides multilateration (MLAT) capabilities, logging, and detailed data analysis tools.
For those new to this hobby, I try to explain why an aircraft enthusiast should choose PlanePlotter over the many sites such as ADS-B Exchane, Flightradar, Flighaware, etc. and some of the many features of this program.
Customization of Maps and Airport Diagrams
- Map Configuration: You can design or modify your own background maps and airport diagrams, incorporating customized features to meet your specific needs. See Part II
Alert Configuration
- Setting Alerts: Configure alerts to identify when a specific type of aircraft or category enters a predefined area. If this event occurs, the system is designed to automatically send you an email notification.
Conditional Display Expressions
- Creating Conditional Expressions: Establish conditional expressions to regulate the display of aircraft based on various parameters such as altitude bands, heading ranges, distance from a specified point, aircraft type, operator, and country of registration. Go to the explanation of Tiiips: PlanePlotter: Conditional Expressions
Multi-Map Display
- Simultaneous Map Displays: The software allows for the display of multiple maps at the same time, each adjustable to different scales.
Airband Receiver Control
Sky View Display
- Visualizing Aircraft Positions: Display a sky view from your location, illustrating visible aircraft in their apparent sky positions.
SkyWatcher Camera Control
- Automating Aircraft Photography: Automate a SkyWatcher camera mount to capture photos of aircraft as they pass overhead.
VHF Direction Finding
- Direction Finding on VHF: Perform direction finding on voice transmissions within the VHF airband to locate the source of transmissions.
Locating Non-Broadcasting Aircraft
- Tracking Without Transponders: Locate aircraft that are not transmitting their positions using signals from multiple radar sites, especially useful in areas with insufficient ground stations for multilateration. This function is also effective for aircraft not equipped with Mode-S.
Script Writing for Enhanced Control
- Script Writing: Write scripts to manage the software’s functionalities, such as cycling through a series of map presentations or setting alerts for directional aircraft movements at specific times of the day.
Tool Identification for Radar Sites
- Radar Site Tools: Use built-in tools to identify and locate radar sites in your area, enhancing your monitoring capabilities.
Installation Instructions for PlanePlotter:
Download the Software:
- Visit the official PlanePlotter website to download the latest version of the software. https://www.coaa.co.uk/planeplotter.htm
- Example:
Planeplotter6_6_9_1.zip
Extract the Files:
- Once downloaded, extract the ZIP file to a folder on your computer using tools like WinRAR or 7-Zip.
Run the Installer:
- Navigate to the extracted folder and locate the installer file (PlanePlotter
.exe). - Double-click to begin the installation process.
Windows Defender Issue:
- Problem: When installing version
Planeplotter6_6_9_1.zip, Windows Defender may flag the file as containing a virus (Trojan Win32./Poma!rfn). - Solution:
- Open Windows Security and go to Virus & threat protection.
- Click on Manage settings under Virus & threat protection settings.
- Scroll down to Exclusions and click Add or remove exclusions.
- Add the folder where the installation file is located as an exclusion.
- Proceed with the installation.
- Important Note: Always ensure the file is downloaded from a trusted source before creating an exception.
Complete Installation:
- Follow the on-screen prompts to complete the installation process.
- Once installed, launch PlanePlotter.
Usage Instructions for PlanePlotter:
Initial Configuration:
- Upon first launch, PlanePlotter will guide you through an initial setup wizard to configure your receiver.
- Specify the type of receiver or SDR you are using (e.g., RTL-SDR, Mode-S receiver).
Set Up Your Receiver:
- Connect your receiver to the computer in the USB port.
- Download and Install an Aircraft Database:
PlanePlotter uses specific SQLite databases to provide detailed information about the aircraft and their routes. The relevant databases include:
- BaseStation.sqb: This database contains comprehensive details about aircraft, including identifiers and characteristics.
- FlightRoute.sqb: This database holds information about various flight routes.
- These databases can be found on the internet and need to be downloaded to your local system. Once downloaded, you should place the database files in the following directory on your computer:
C:\Tools\COAA\PlanePlotter\Logfiles. - After installing the databases,
- proceed to integrate them into PlanePlotter by navigating to:
- Options > Directories > SQB Aircraft database Here, select the database you have installed.
- By setting up the map and the databases, PlanePlotter will be able to provide a comprehensive visual and data-driven tracking experience, showing not just the aircraft positions but also detailed information about each flight and its route.
Data Visualization:
- Once configured, PlanePlotter will begin decoding signals and displaying aircraft positions on the map.
- Customize the display by selecting layers, routes, and additional data overlays.
Sharing Data:
- To share data with the PlanePlotter network, enable data sharing in the settings menu.
- Joining the network allows you to see aircraft tracked by other users and contribute to MLAT calculations.
- Warning: In many countries, listening to the air frequency is forbidden. Check your country’s current legislation.
Advanced Features:
- Use the Multilateration (MLAT) feature to determine the positions of non-ADS-B aircraft.
- Explore the logging and analysis tools for detailed reporting of received data.
Troubleshooting Windows Defender Issues:
If Windows Defender continues to block PlanePlotter:
- Verify the file's integrity by comparing its checksum (if provided on the official website).
- Consider temporarily disabling real-time protection during installation but re-enable it after completion.
- Reach out to the PlanePlotter support forum or community for guidance if issues persist.
Part II
Guide to Finding and Installing MapQuest Maps in PlanePlotter and Obtaining a Free API Key
Using MapQuest maps in PlanePlotter can enhance your monitoring experience by providing detailed geographical views. Here's a step-by-step guide on how to find, integrate MapQuest maps into PlanePlotter, and obtain a free API key for up to 15,000 maps per month.
Step 1: Understand MapQuest Integration
Before beginning, it's important to know that PlanePlotter can directly integrate mapping services like MapQuest through the use of an API key.
Step 2: Obtain a Free MapQuest API Key
- Create a MapQuest Developer Account: Visit the MapQuest Developer site and sign up for an account.
- Generate an API Key: Once you have access to your account, navigate to the API key management section and create a new key. MapQuest offers up to 15,000 free transactions per month, which is sufficient for many non-commercial users.
- Copy the API Key: Once generated, copy the key for later use.
Step 3: Configure MapQuest in PlanePlotter
- Open PlanePlotter: Start the application on your computer.
- Enter the API Key: Go to Option, then Chart, and select MapQuestKey. Paste the API key you obtained from MapQuest here.
Step 4: Using Maps in PlanePlotter
Once the API key is entered:
- Select the Desired Type of MapQuest Map: You can choose from various map options offered by MapQuest directly within PlanePlotter.
- Verification and Calibration: Ensure that the maps are correctly aligned with the displayed aircraft positions. You may need to adjust calibration settings for precise alignment.
Step 5: Updates and Maintenance
- Keep the API Key Updated: Ensure your API key remains valid and monitor the number of requests to avoid exceeding the free limit.
- Update Maps: Periodically check for updates or changes to MapQuest services that might require updates to your PlanePlotter configurations.
Guide on How to Load and Calibrate a Chart in PlanePlotter
Loading and calibrating maps in PlanePlotter can significantly enhance your monitoring experience. Here's a step-by-step guide on how to load a digitized chart and properly calibrate it:
Step 1: Load the Chart
- Open PlanePlotter: Launch the application on your computer.
- Load the New Chart: Select File > Load new chart. Choose the BMP or JPG file that you have created by digitizing your chart.
- Warning Message: You will see a warning message indicating that the chart is not yet calibrated. This means that the program did not find a calibration file with the same name in the same directory. The following steps will guide you in creating such a calibration file.
Step 2: Explore the Chart
- Initial View: When the chart is first displayed, it is scaled so that the entire chart is visible in the window.
- Zoom In: You can zoom into the chart by clicking on the Zoom In button.
- Navigate: You can move around the chart by dragging anywhere in the window.
- Zoom Out: You can zoom out by clicking on the Zoom Out button.
Step 3: Calibrate the Chart
Follow this video www.coaa.co.uk/map-calibration.mp4 or these instructions:
To calibrate a map in PlanePlotter, follow these detailed steps:
Load the Map: Insert a map in .jpeg format into the directory Tools>COAA>PlanePlotter>Chartfiles.
Opening and Error Message:
- Open the map by clicking on the .jpeg file.
- Click OK on the error message "…Calibrate the map before use".
Initiating Calibration:
- Click on the Calibrate icon (tenth from the left) to start the map calibration procedure.
Adding the First Calibration Point:
- Select a point on the map and click on it.
- In the message that appears, enter the latitude and longitude of the point (these coordinates can be obtained via Google Earth) in the following format:
- E.g., N44 space 43.25, W23 space 11.07.
- Press OK.
- Go to
Options>Map calibration>Add calibration point. - Go to
Options>Map calibration>Display calibration point, and a red circle will appear at the location where the first calibration point was created.
Repeating for Additional Points:
- Repeat the calibration operations for three additional points, starting from the Calibrate icon.
Viewing and Saving:
- Go to
Options> Map calibration>Display geo grid to display a grid of small red crosses. - Go to
Options> Map calibration>Save calibration data, and in the window that opens, confirm the map indicated with OK.
Removing Visual Calibration Points:
- Disable
Options>Map calibration>Add calibration point. - Disable
Options> Map calibration>Display geo grid.
Adjusting Map Transparency:
- To make aircraft more visible on the map, go to
Options>Chart>Transparency. - In the window that opens, set a transparency value from 0 to -100%. Personally, I have set a value of -20%.
Modifying Aircraft Symbols:
Step 5: Advanced Calibration
- Default Linear Transformation: For the default linear transformation, you need at least three calibration points, although more will be better.
- Second Order Polynomial Feature: If you have charts covering larger areas, you might want to use the Options > Map calibration > Second order polynomial feature, in which case you need at least six well-distributed calibration points, preferably more.
Final Notes:
PlanePlotter is a tool for aviation enthusiasts, but it requires complicated installation and very detailed configuration with hundreds of parameters to avoid compatibility problems. Always be sure to download it from reliable sources and follow the directions for optimal configuration. The free version expires after 21 days and the paid version costs €25 + VAT.